From Excel Plan to Critical Path: How a Special Machinery Builder Manages Its Projects On-Premise
The project plan lives in Excel, while the actual status is spread across SAP, PLM, Teams and the lists kept by each department. A special machinery builder with around 100 million euros in revenue brings both together with OPAIRS: plan and actuals are compared, the critical path becomes visible and the AI derives recommendations. The result: up to 10% fewer project hours and up to 15% less search time. All data stays in-house.
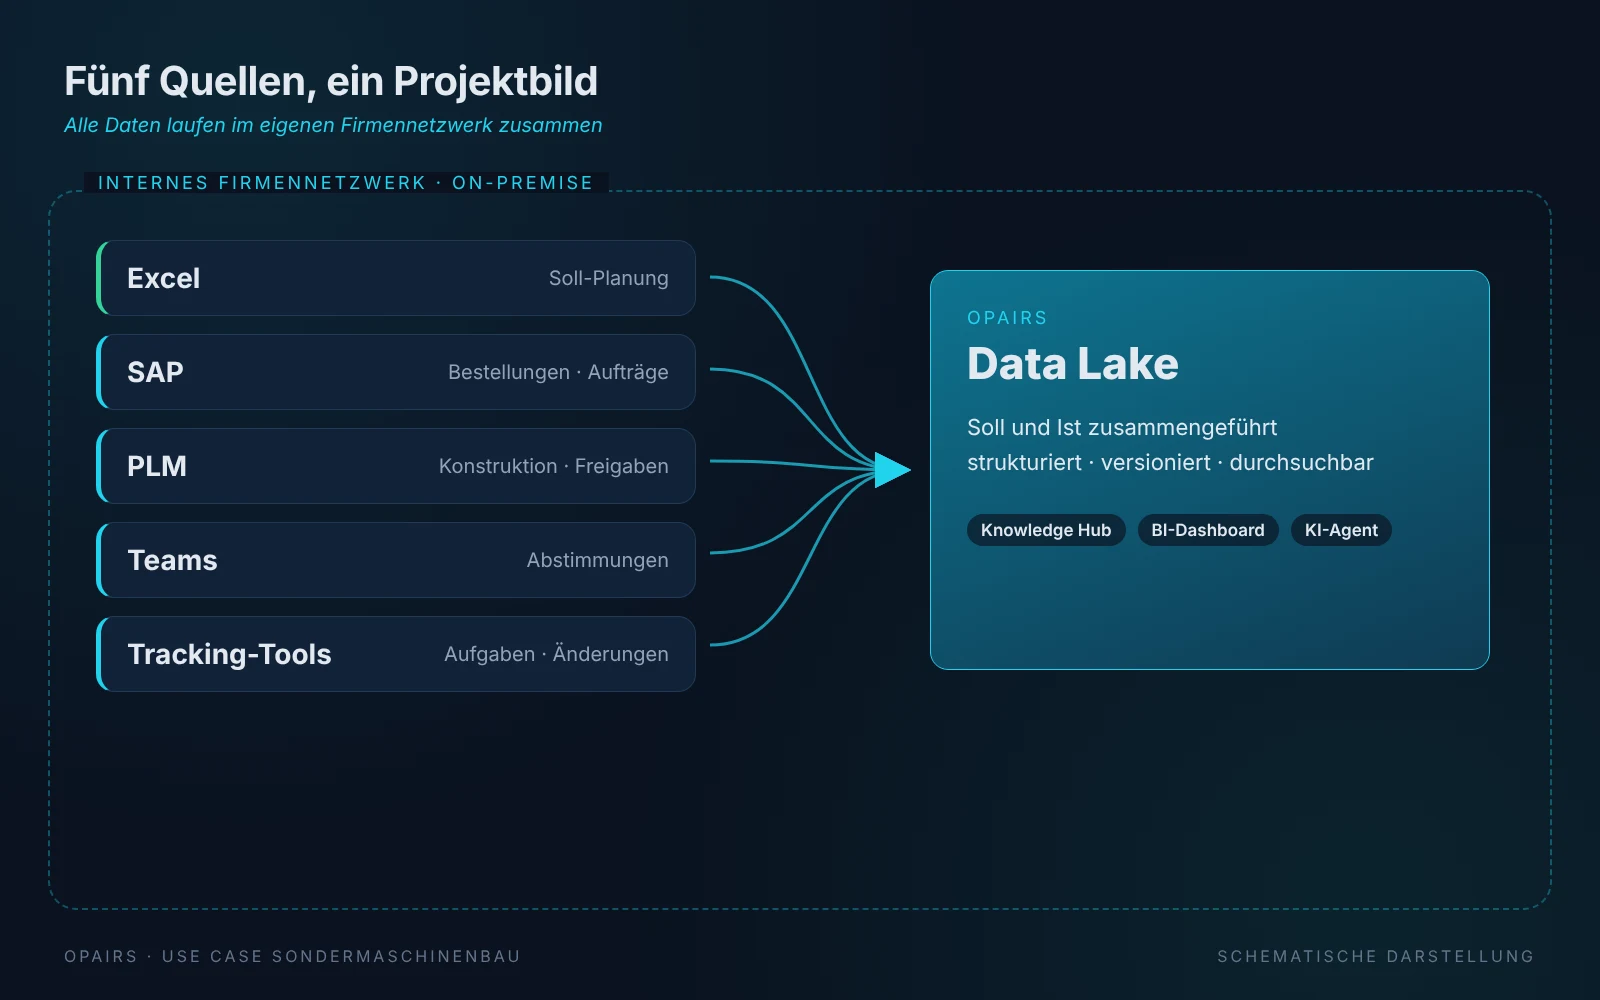
In special machinery, no two projects are alike. Every machine is engineered, procured, manufactured, assembled and commissioned for a specific customer, and each of these steps involves different departments, different systems and different suppliers. Anyone who wants to know whether a delivery date will hold has to pull all of this together. Together with OPAIRS, a special machinery builder with around 100 million euros in revenue has automated exactly that, from on-site analysis to a productive AI system.
Starting point: a project under penalty
The trigger was a project with a contractual penalty, combined with a shortage of skilled staff, growing reporting effort and the requirement to cut delivery time by 10%. At the same time, the status of a machine was nowhere fully visible: order management, purchasing, engineering and production each knew only their own part.
Every department kept its own lists in Excel, MS Project or on shopfloor boards. Dates were entered in SAP but not aligned with the Project Execution Plan (PEP). With bills of materials of more than 40,000 parts across nine levels, consistent tracking across all levels was hardly possible.
Analysis: understanding the real process
Before anything was digitized, we mapped the process as part of an interim management mandate, directly in the plant and on the shopfloor: step by step from engineering via purchasing to assembly and acceptance, the way it actually runs rather than the way it is written down. The main weaknesses:
- Five system worlds with media breaks: SAP, Excel, MS Project, PLM and shopfloor boards – data is copied around and drifts apart
- Schedule gap: SAP dates are not aligned with the PEP, and departments plan in parallel
- Software preparation without reference to project milestones: its progress is not linked to the overall plan
- Eight feedback loops: three change processes between engineering and assembly, five rounds of troubleshooting during commissioning
- Commissioning as the bottleneck: most feedback loops and the longest tasks, at 30 to 57 days, fall into this phase
- Double data entry and several parallel open-item lists during acceptance
The data sources
- Planned status in Excel: project schedule at module level, target dates for design release and the internal production plan
- SAP S/4HANA: bills of materials, production orders and purchase orders
- PLM: design and release status from draft to released
- Microsoft Teams and Planner: tasks, coordination and decisions
- Documents: changes filed as PDF, wiki pages and minutes
- Shadow sources in the departments: MS Project, shopfloor boards, acceptance lists and paper forms
Key to acceptance: nobody had to switch tools. Planners keep working in Excel, purchasing and production in SAP, engineering in PLM. OPAIRS reads these sources automatically and brings them together instead of replacing them. Data gaps were identified during the analysis and closed specifically.
Pilot: the data lake as a single point of truth
In the pilot, SAP exports, the production plan, bills of materials and documents were loaded automatically and in structured form into a dedicated data lake at the customer site. Rules and AI models work on this shared foundation, and the results appear in the dashboard without manual compilation. The first quick win: a single point of truth that immediately reduced reporting effort in project management.
How OPAIRS works in the project
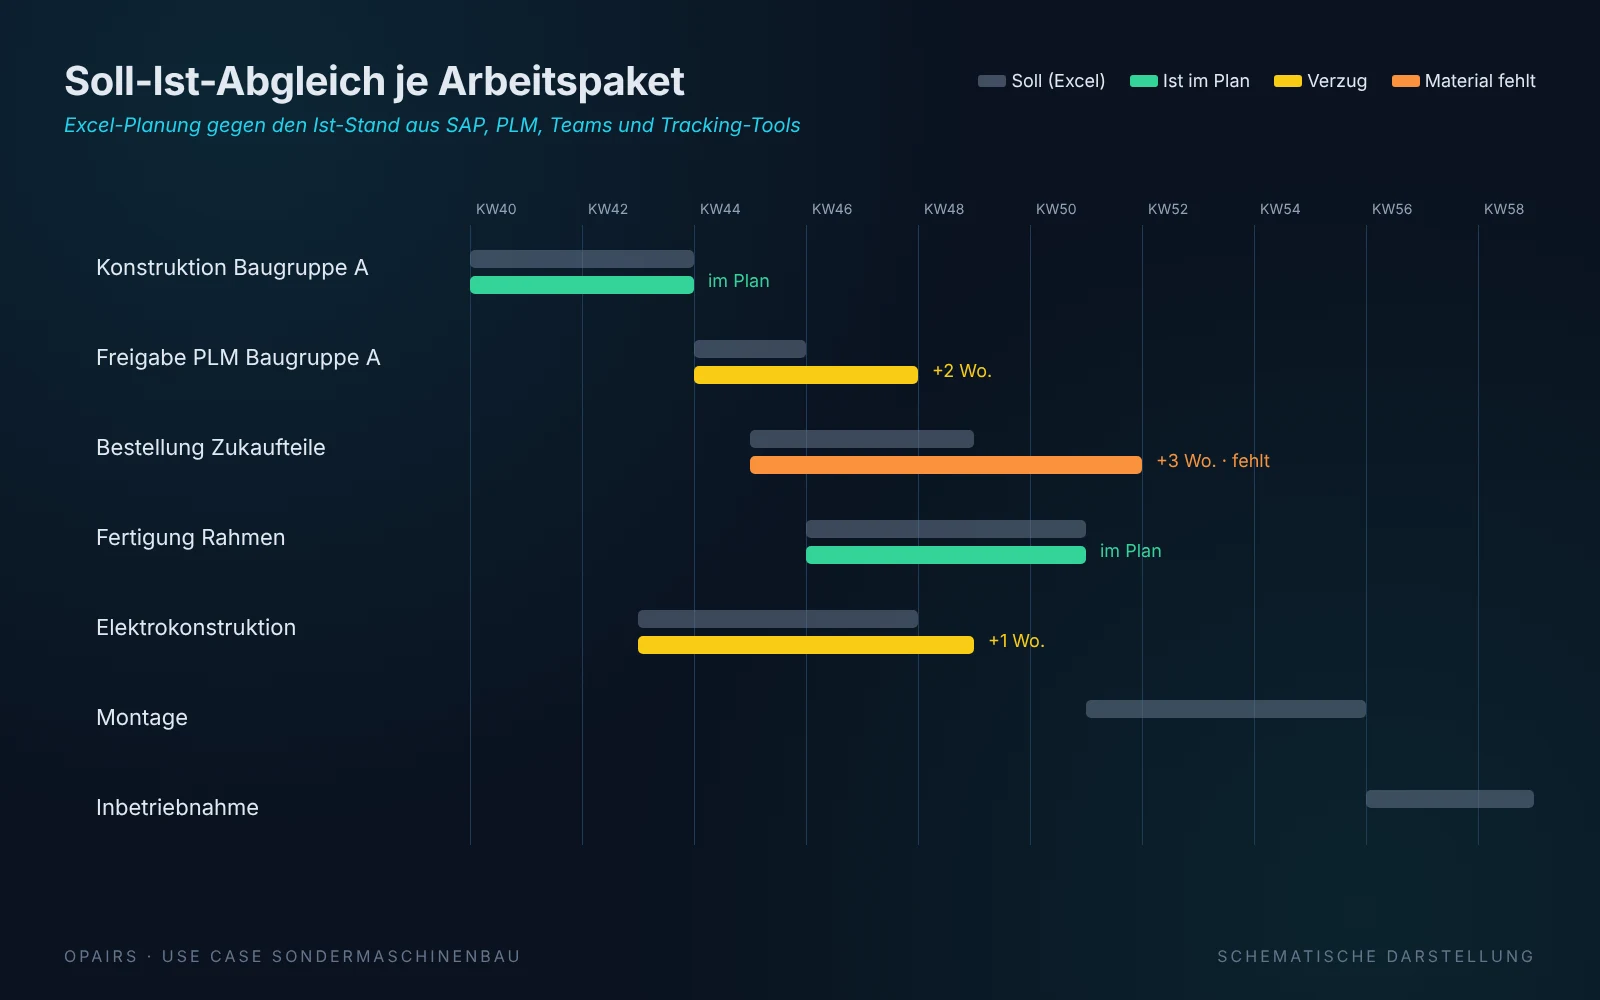
Plan-versus-actual comparison for every work package
OPAIRS places the plan next to the actual status from all connected systems. For every machine it becomes visible where in the overall process it is stuck: on a component, a purchase order or a production step. Deviations are reported automatically before they put the schedule at risk, instead of being collected in meetings.
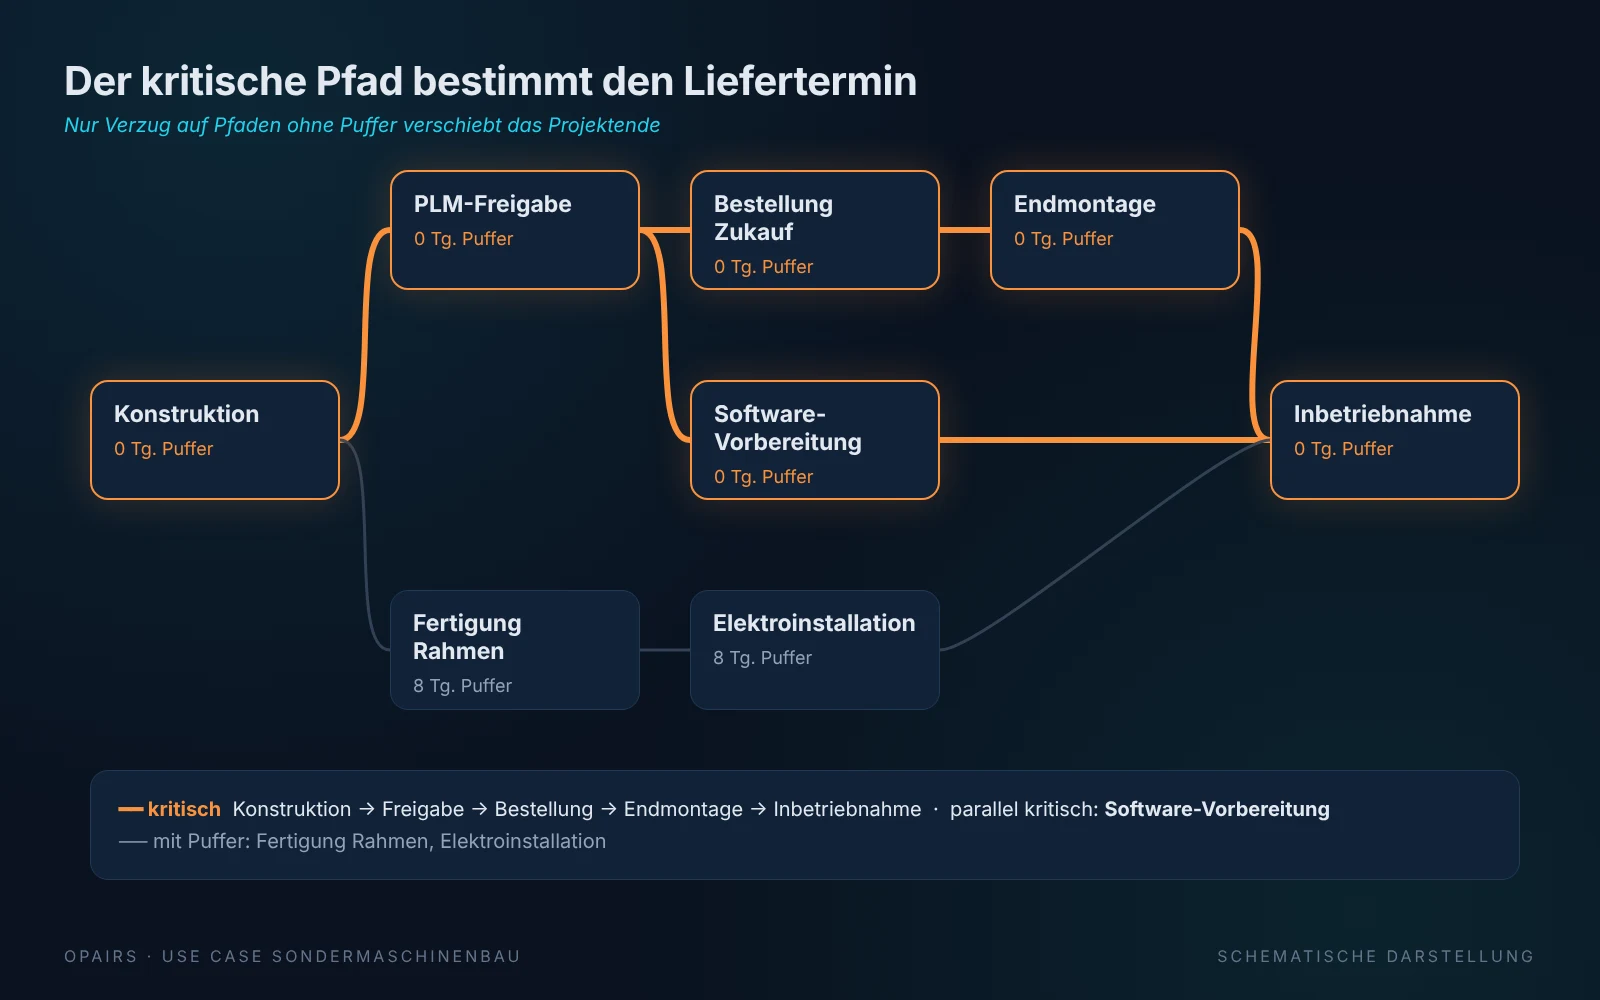
Identifying the critical path
From this comparison, OPAIRS determines the critical path of the project: the chain of work packages without slack that defines the end date. Alongside the chain of engineering, release, purchasing, final assembly and commissioning, software preparation also runs without slack and is therefore critical in parallel. Project management sees at a glance which delays actually threaten the delivery date and which still have slack.
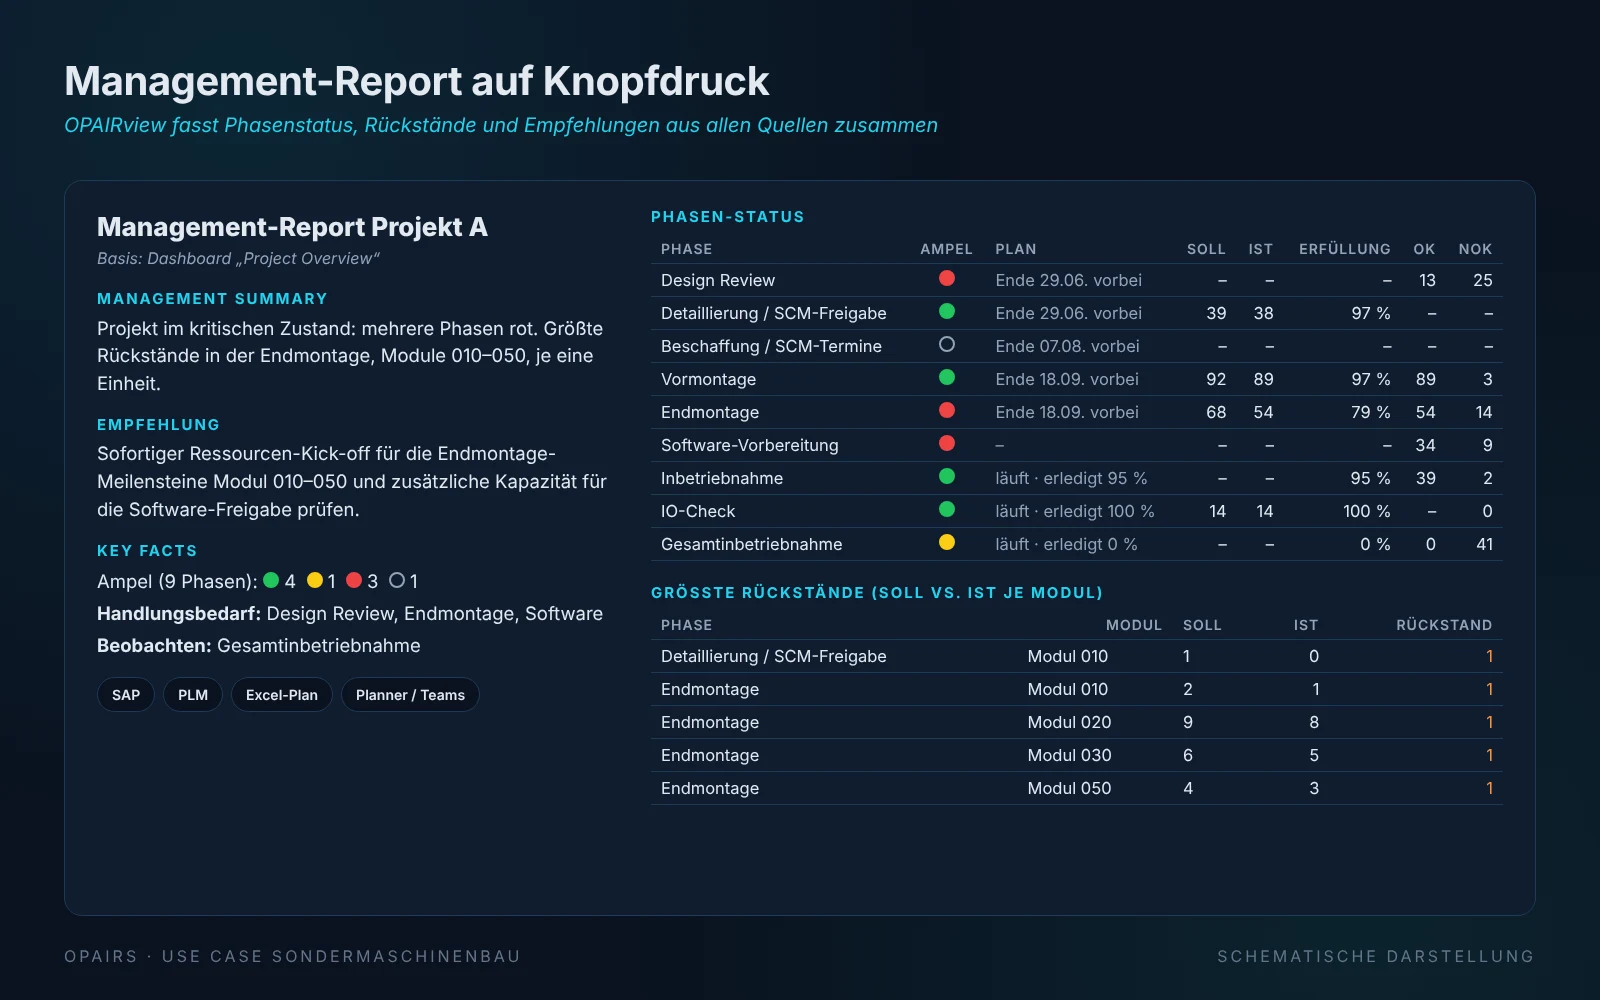
Management report with recommendations
At the push of a button, the OPAIRview agent creates a management report: traffic-light status per phase, plan and actuals, the largest backlogs per module and a management summary with a concrete recommendation, such as a resource kick-off for final assembly or additional capacity for the software release. For details, project managers ask follow-up questions in the chat, for example about an SAP number, and receive the related purchase orders, wiki pages and documents, so every statement can be traced back to its source.
Further applications in daily production
- Assembly assistant: drawings, instructions and documents in seconds instead of minutes, right at the workstation
- Automated gap detection: deviation monitoring per business process phase with automatic alerts
- Automation in the background: new projects are set up from a template, created after user approval and checked for data errors; documents are processed automatically per project
Because everyone works from the same data, meetings turned into problem-solving sessions instead of data-gathering exercises.
Result: measured, not estimated
Testing took place with real users in their daily work, first in selected departments and with short feedback cycles. The effect was measured via the ERP hours booked on the project, before and after the rollout:
- Up to −10% project hours
- Up to −15% operational search time and reporting effort
- The budget gained made it possible to deploy a dedicated data analyst who consolidates several projects at once
Architecture: data sovereignty by design
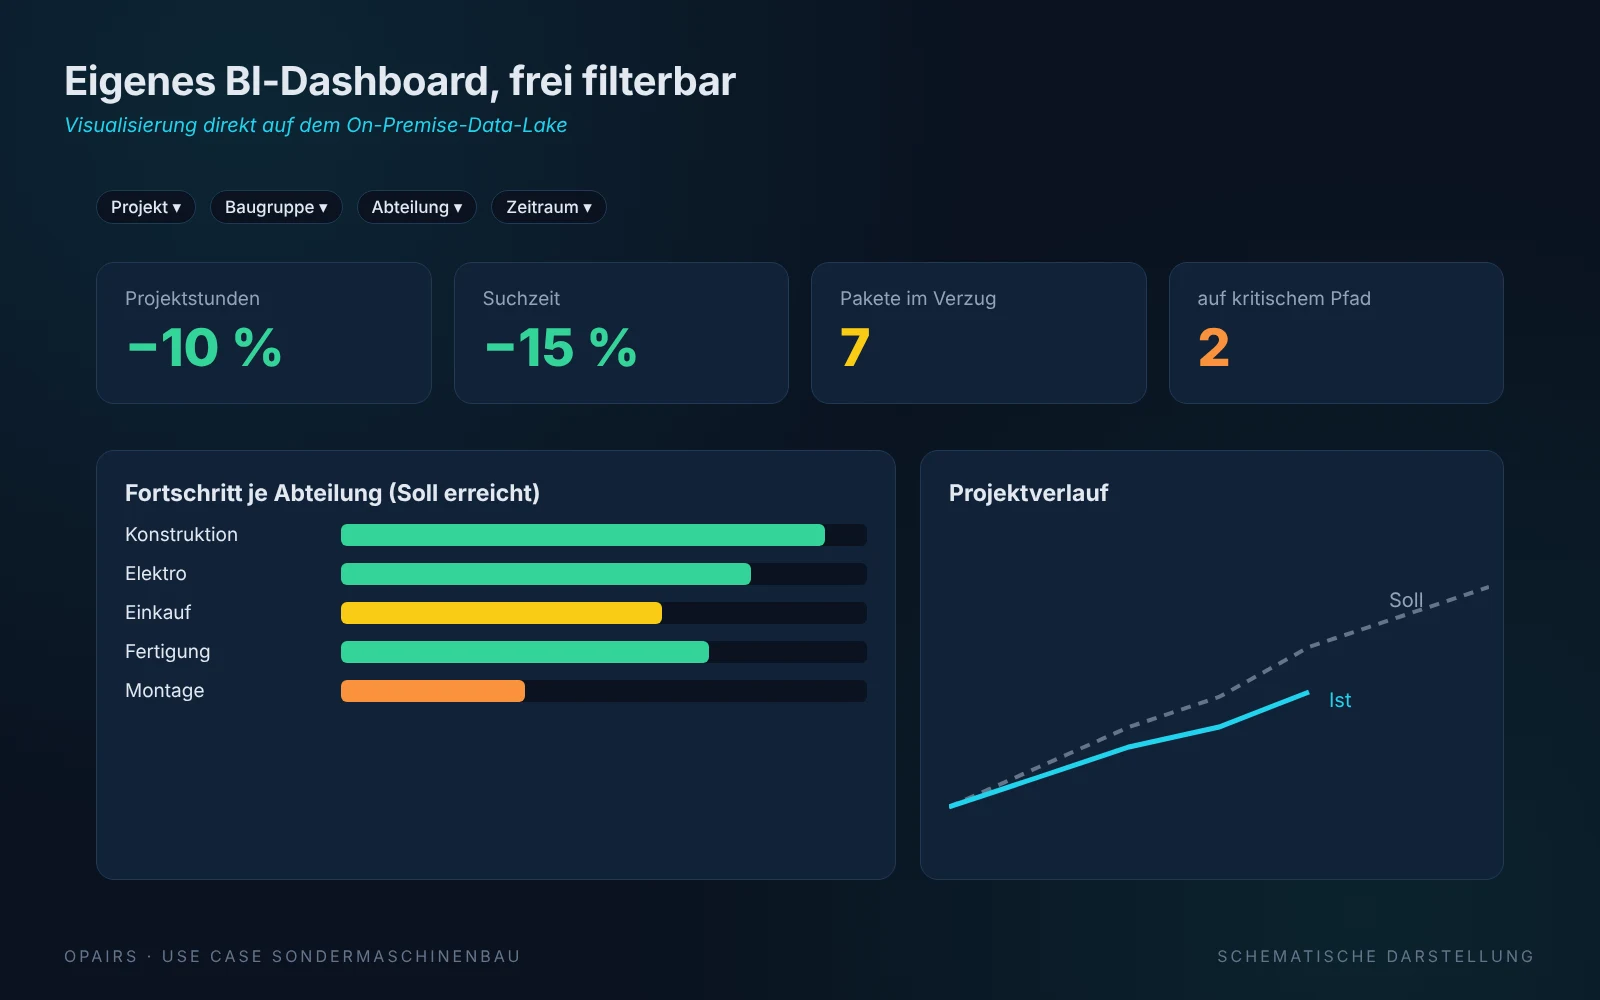
On-premise data lake and a dedicated BI dashboard
The foundation is a data lake that runs on-premise at the customer site. No customer or project data leaves the system or the internal company network – neither for analysis nor for the AI, and there is no dependency on external services. Everything is visualized in a dedicated BI dashboard that can be filtered by project, assembly, department or time period. Shopfloor, department heads and management each see their own view of the same data.
Outlook: every project makes the next one smarter
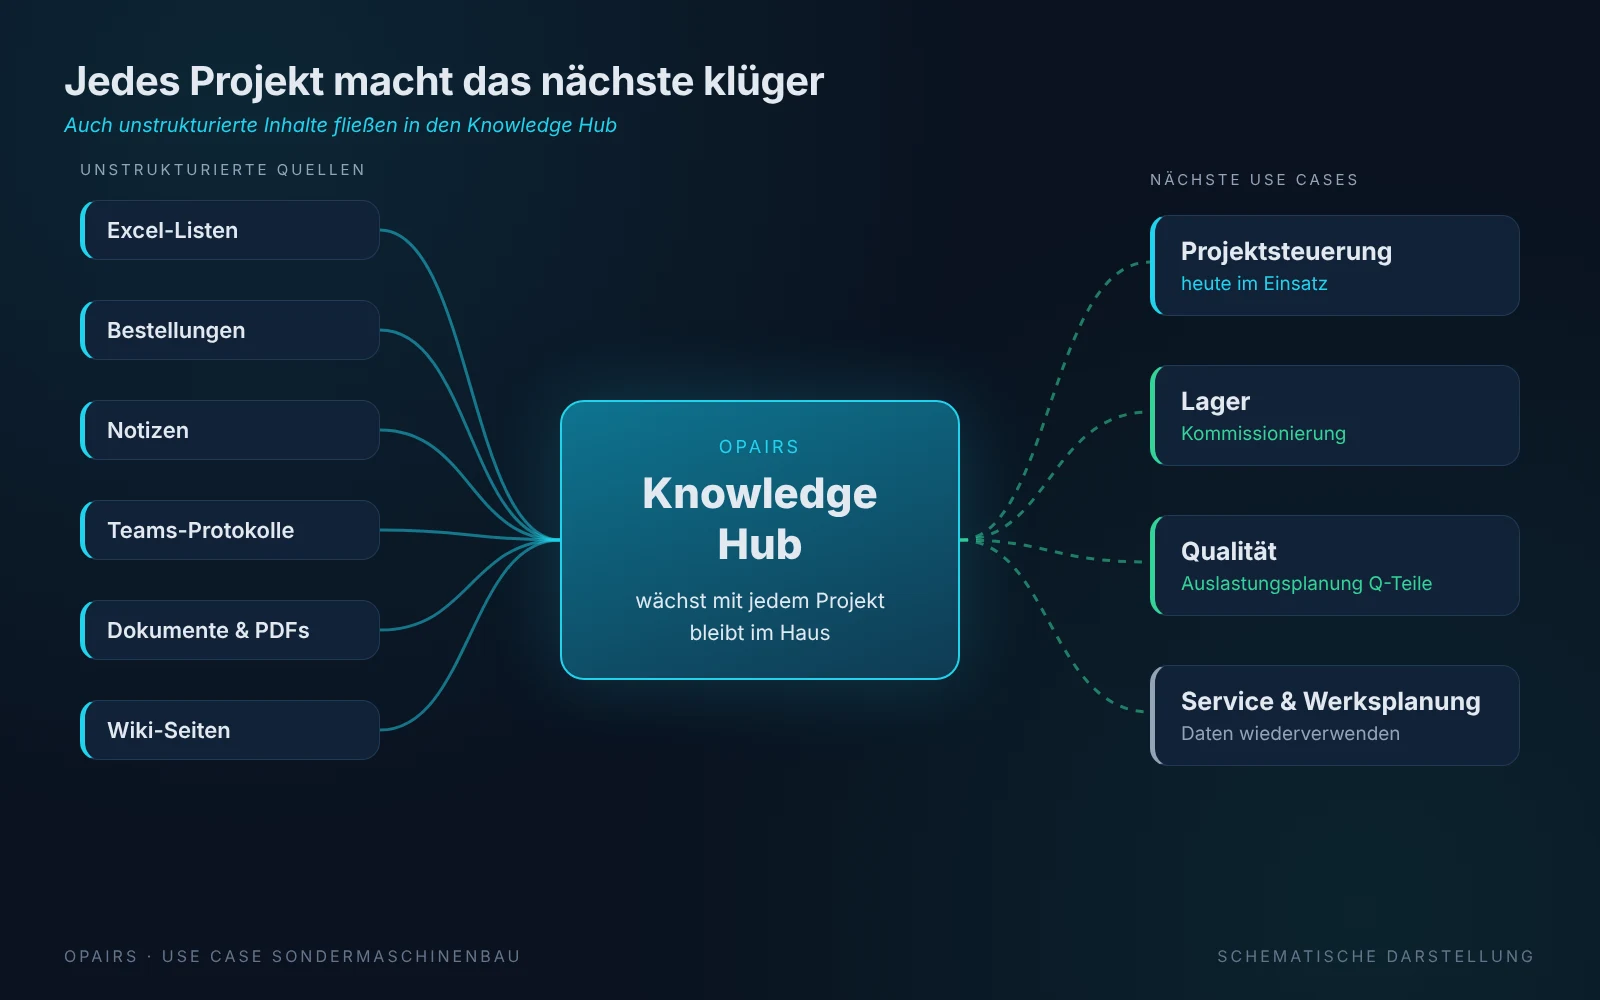
The next steps are planned
The production system now runs on a dedicated server at the customer site, and the pilot is being extended to a further location. For the first time the data is structured – not only the tables from SAP and PLM: unstructured content such as Excel lists, purchase orders, notes, Teams minutes, documents and wiki pages also flows into the knowledge hub. The next use cases build on this: operational support for the warehouse in order picking, and capacity planning for quality assurance across all quality-relevant parts, derived from the individual parts that need to be inspected. Because OPAIRS builds its own knowledge hub, the AI’s answers improve with every completed project.
Reference available on request
The detailed customer use case, including a reference, is available on request. It was already presented in the 9th webinar “KI Use Cases & Future Skills” of Plattform Industrie 4.0 Austria on 22 October 2026, under the title “Maschinenbau AI-Ready: Transformation eines Produktionsprozesses” (in German): https://plattformindustrie40.at/blog/event/9-webinar-ki-use-cases-future-skills/
Would you like to manage your projects with the same transparency or request the reference? Contact us: office@opairs-systems.com
More insights
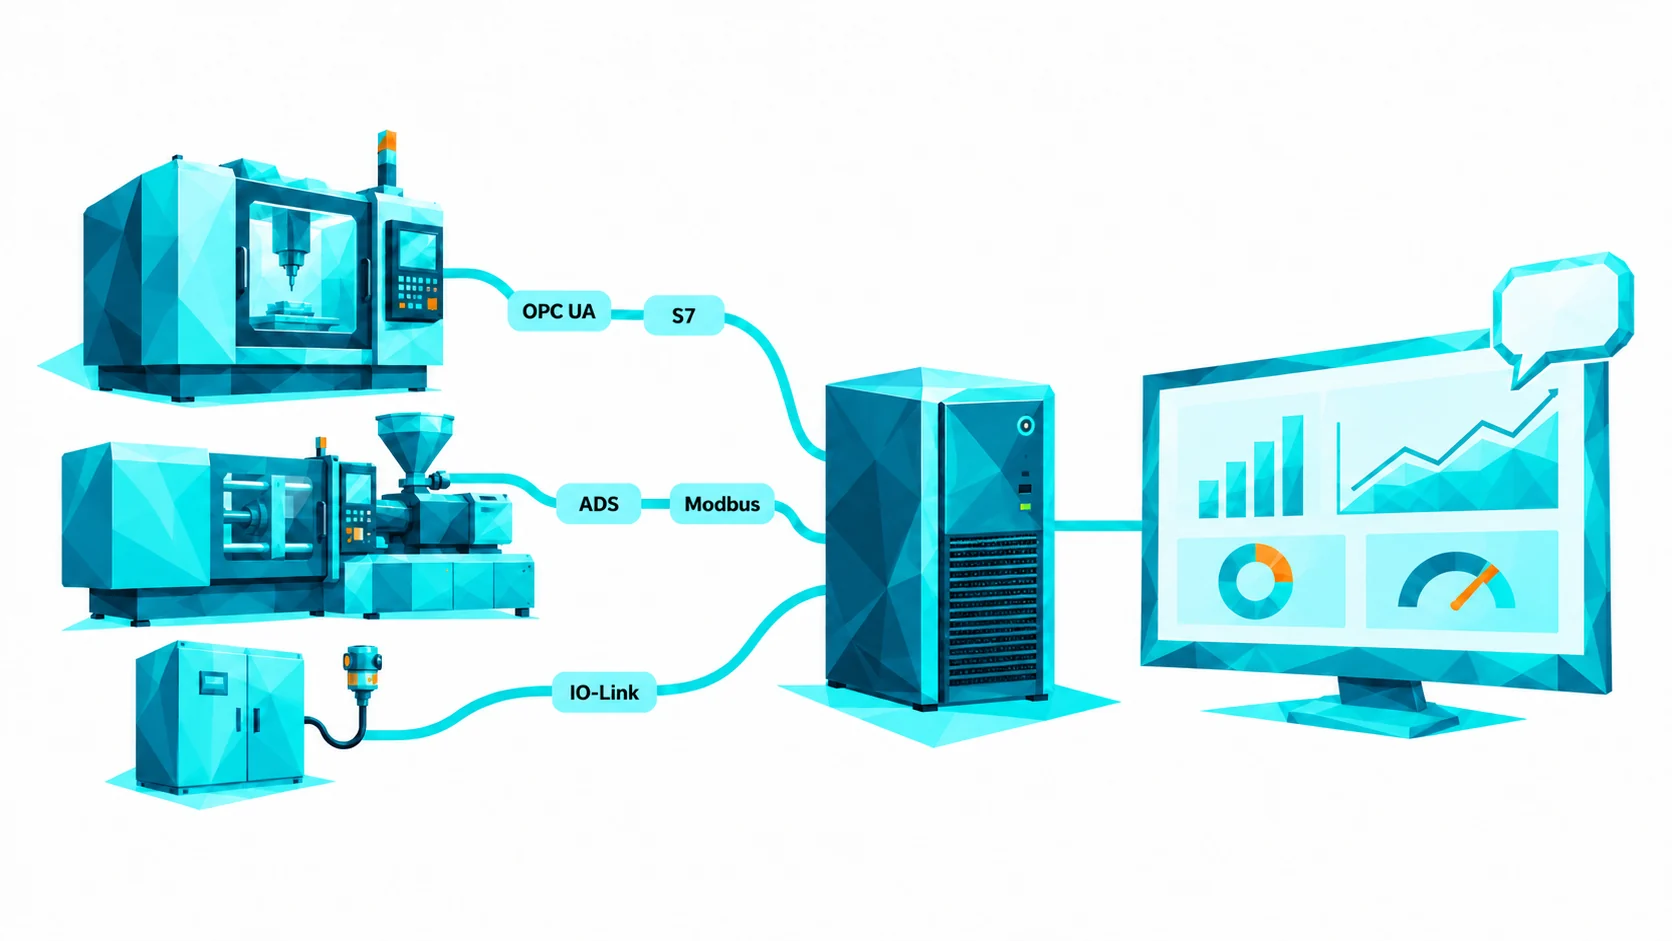
Cyber-Physical Systems with OPAIRS®: Connecting Machines and Sensors On-Premise
So far, OPAIRS has learned from ERP systems, documents and databases. With OPAIRS Connect Machine, the machines themselves join in: controllers, sensors and equipment deliver their values via OPC UA, Siemens S7, Beckhoff TwinCAT, Modbus, EtherNet/IP or IO-Link into a local database that the OPAIRS® Dashboard and AI agents read from. Everything runs in-house, without the cloud and without a connection to external services.
Read article
OPAIRS SBOM Scanner: Continuous Vulnerability and Supply-Chain Monitoring for the Cyber Resilience Act
Since 11 September 2026, manufacturers must report actively exploited vulnerabilities in their products within 24 hours – from December 2027 the Cyber Resilience Act applies in full, including a software bill of materials. To report, you first need to know what is inside your own software. OPAIRS built a scanner for that: it runs entirely on-premise, watches continuously and only raises the alarm when it matters.
Read article