OPAIRS Forecasting: Self-Hosted Time-Series Forecasting for Manufacturing
How much material will we consume next quarter, when will energy demand rise, which items will run out? Time-series forecasts answer questions like these – usually through cloud services that production data has to be sent to. OPAIRS has built its own forecasting service that runs entirely on-premise, recommends a model only when it demonstrably beats a simple baseline, and connects with the SQL Agent into one continuous chain: query the data, forecast, evaluate.

Almost every question in manufacturing has a time dimension: How will material consumption develop next quarter? When will energy demand rise? Which items will run out before the next order arrives? The data foundation for this is time series from ERP, MES, energy management and maintenance. Cloud forecasting services require these series to leave the building – for consumption, order and machine data, that is a dealbreaker for many manufacturers.
OPAIRS has therefore developed its own forecasting service. It runs entirely on-premise, stores no data and can be used in two ways: through the LiteLLM gateway, which then remains the single endpoint for all agents, or directly as an MCP server by any agent that speaks MCP. The goal was not to celebrate a single model, but to build a service that shows when its forecast can be trusted.
One Service, Several Models, One Endpoint
The service bundles three model families behind one interface:
- Statistical models (seasonal naive, ETS, Theta, ARIMA): fast, robust and often hard to beat on short series.
- Chronos-Bolt: a pretrained time-series foundation model that produces forecasts without training on your own data.
- TiRex-2 from NXAI: another foundation model, also operated locally.
The models are stored as weights in-house, with no downloads at runtime. The service is stateless: the time series arrive with the request, the result goes back, nothing is stored. It is accessed via REST or as an MCP server, either through LiteLLM or directly, without any change to the service. Pipes and agents therefore contain only logic; the models themselves run in the service.
A Model Is Chosen Only If It Beats the Baseline
Which model fits best depends on the series. The service does not decide by gut feeling but by rolling-origin backtest: all candidates forecast several past sections of the series that the service already knows, and are measured against the actual values. A simple baseline serves as the yardstick: the seasonal value from the previous year (seasonal naive). The metric is the relative error: a value below 1.0 means the model is better than the baseline.
If no model beats the baseline, the service still returns a forecast but explicitly marks it as not validated and adds a warning. It does not claim quality it has not measured. For users, this is the most important difference from a forecast that always looks equally confident.
If at least two models beat the baseline, one more candidate is added: the average of the two best. It is scored in the backtest like any other model and replaces the best single model if it is only marginally worse. The reasoning: with few backtest windows, the rankings are noisy, and averages usually generalize better than a single pick.
Benchmark on Twelve Public Time Series
For orientation, OPAIRS tested the service on twelve public time series: monthly, quarterly, weekly, daily and hourly, including airline passengers, car sales, sunspots, temperatures, beer production, gasoline demand and transformer data. The end of each series was held back, the service forecast using only the remaining data, and the result was compared with the true values (relative error against the baseline, lower is better):
- Automatic selection with ensemble: 0.713, better than the baseline on 11 of 12 datasets.
- Automatic selection without ensemble: 0.757.
- TiRex-2 alone: 0.731.
- Chronos-Bolt alone: 0.768.
- Theta: 0.831.
- ETS: 0.952.
Two things stand out. First, no model is best everywhere: the foundation models are stronger than ETS and Theta on average, but on individual series a statistical model comes out ahead. That is exactly why selection by backtest pays off. Second, the ensemble mainly prevents outliers: on the weekly gasoline data, the automatic selection scores 0.98, whereas Theta chosen on its own would have scored 1.23.
What the Numbers Do Not Prove
Twelve datasets with one hold-out period each are a small sample. Differences below roughly 0.03 are noise. In addition, the ensemble rule was designed after a first run on the same data, even though the tolerance factor was fixed in advance and not tuned afterwards; the values are therefore slightly optimistic. On a pure noise series (daily birth counts), no model beats the baseline, and the service reports that instead of pretending to quality. And: all data is public. A test with real production time series is still outstanding.
Runs on CPU Only
The forecasting service does not need a graphics card. The GPUs stay reserved for the language models; the time-series models run on the server's CPU. The statistical models compute each series on one core and are spread across several processes for larger requests, while the foundation models use several cores at once. On a server with 80 CPU cores, a request with 50 time series including backtest and model selection takes about 17 seconds, and one with 200 time series about 35 seconds – roughly 340 series per minute. At startup, the service preloads all default models (about 27 seconds) so that the first real request does not pay for a cold start.
Working Together with the SQL Agent
Most time series already sit in the databases that the OPAIRS SQL Agent opens up: consumption, order and machine data in PostgreSQL, T-SQL or Apache Iceberg. This results in a continuous chain: the SQL Agent fetches the series from the source system, the forecasting service computes forecast and backtest, and the result returns to the chat with model choice, quality and warnings. An example pipe for OpenWebUI already shows this: it reads the data from an SQL block or a CSV and calls the service through LiteLLM. It is meant as a test and example integration, not as a finished product.
More on the SQL Agent and the six LoRA adapters compared: https://opairs-systems.com/en/insights/opairs-sql-agent-datenbanken-adapter-vergleich
Open Source on GitHub
The service is open source under the Apache 2.0 license on GitHub: https://github.com/OPAIRS/opairs-forecast. The repository contains the code, tests, a Docker example, the benchmark to reproduce the numbers and documentation in English and German. Only libraries and model weights whose licenses permit such use are employed; the weights themselves are not shipped. The service is an implementation of its own, not a wrapper around existing forecasting frameworks. Anyone who wants to review, rebuild or extend it can do so without depending on OPAIRS.
Wanted: Real Time Series from Manufacturing
Public datasets show that the model selection works. Whether it holds up on real production data can only be shown by real production data. OPAIRS is therefore looking for partners who want to test the service on their own time series: consumption, demand, energy or machine KPIs, ideally with at least two years of history per item or machine. Processing remains local or under the partner's control. Feedback and contributions are also welcome directly through the repository. The cases in which the service cannot deliver a validated forecast are especially interesting: they show where better data, more context or additional models are needed.
For technical collaboration, joint validation or industrial projects: office@opairs-systems.com
More insights
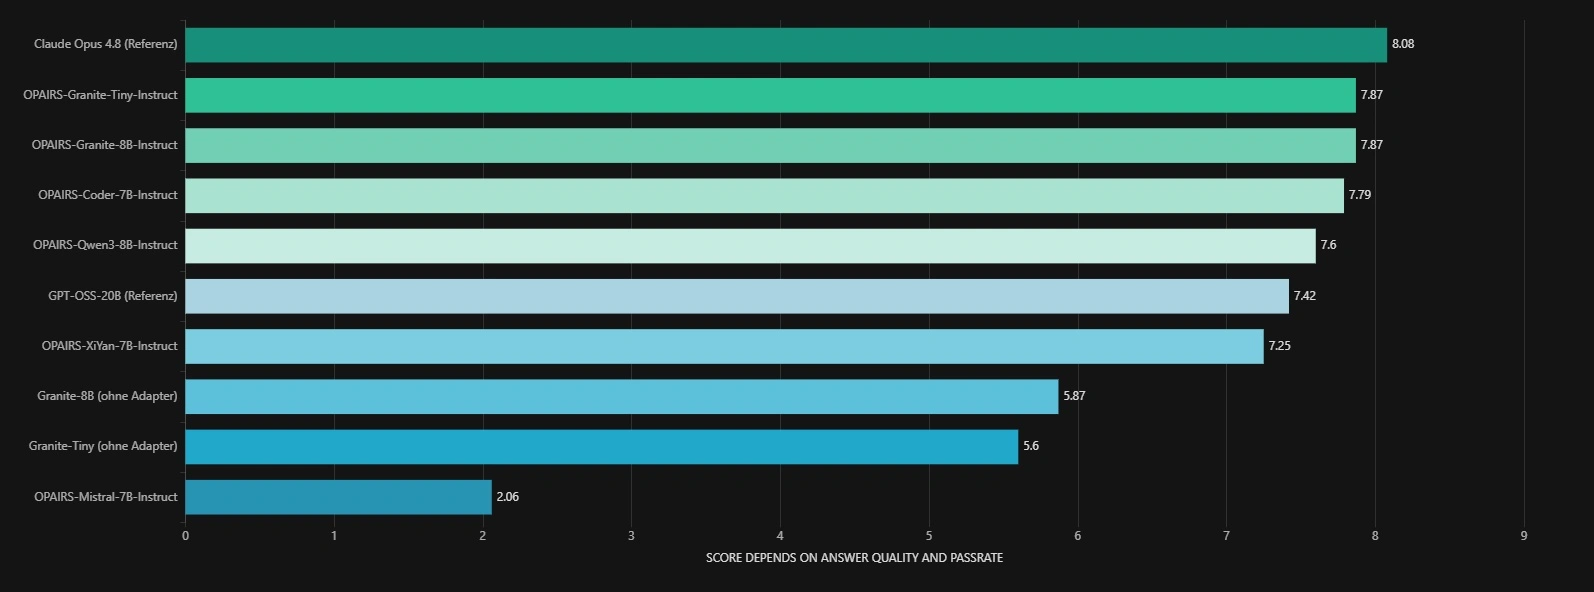
OPAIRS SQL Agent: Comparing Six LoRA Adapters for Industrial Databases
Six LoRA adapters, a 26-question catalog spanning PostgreSQL, T-SQL and Apache Iceberg databases, two external reference models: OPAIRS has systematically evaluated its SQL agent. Two Granite adapters lead the field. For production use, however, the deciding factors are not only answer quality but also speed, memory footprint, concurrency and the available context from ERP, MES, PLM and other industrial systems.
Read article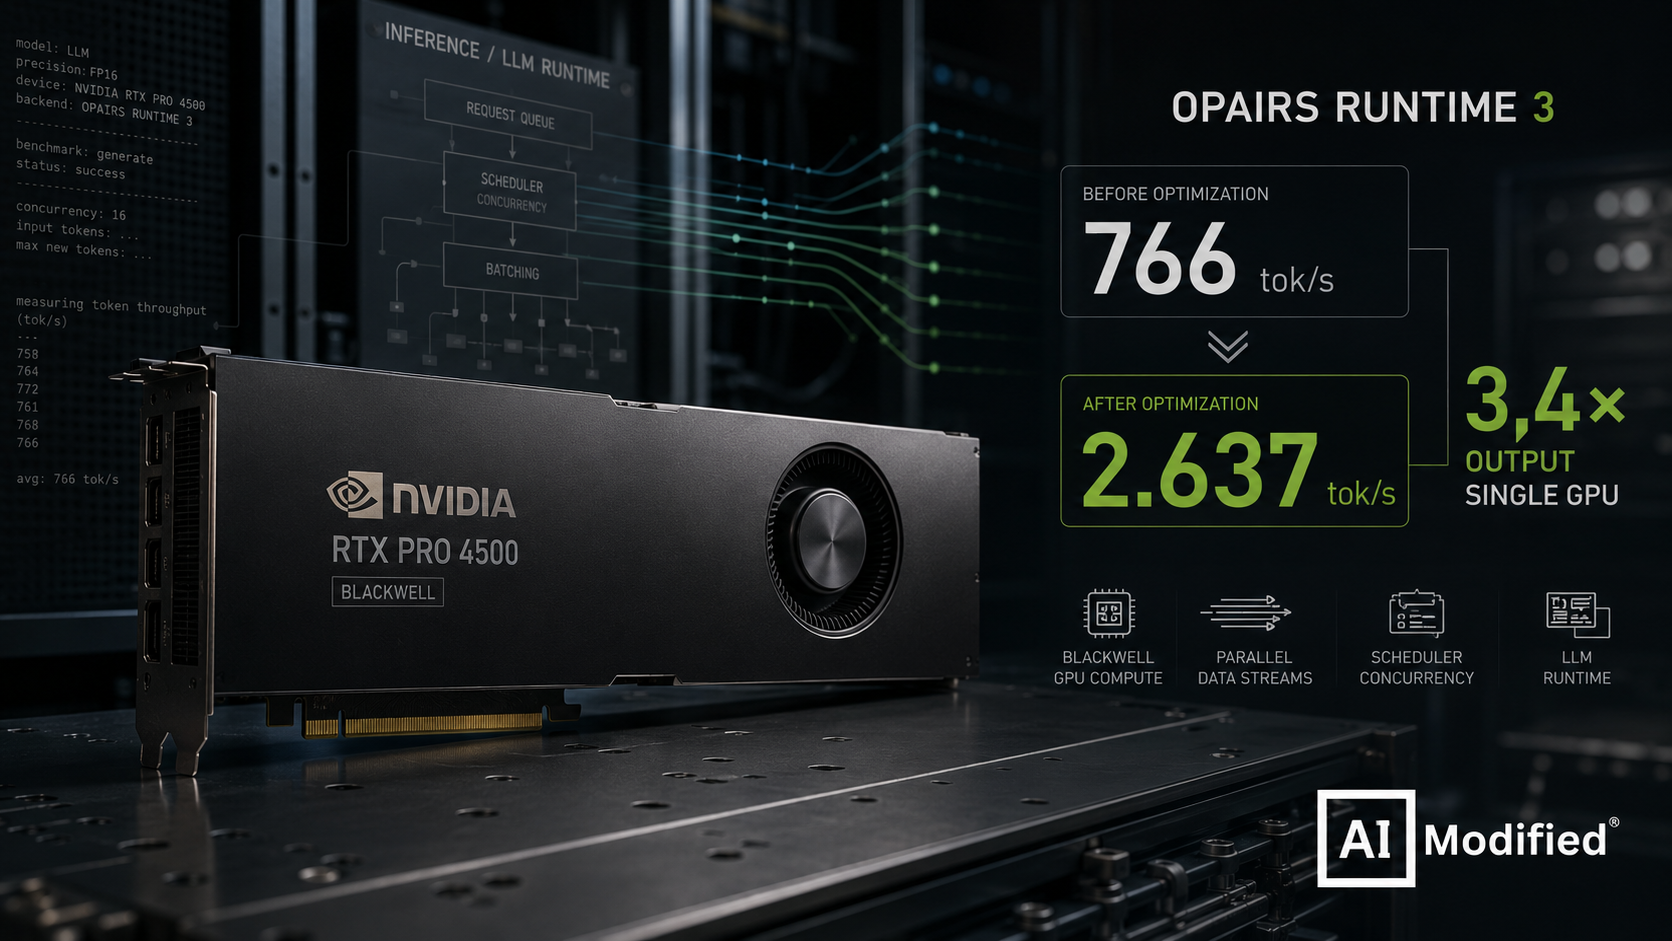
RTX PRO 4500 Blackwell: 3.4x LLM Throughput Through Runtime Optimization
Same GPU, same main model, up to 3.4x the output: OPAIRS Runtime 3 raises the throughput of GPT-OSS-20B on the RTX PRO 4500 Blackwell to up to 2,637 tokens/s. At the same time, the tests show why Qwen3.8-27B will not take over the production stack for now.
Read article